Overview
vk phylo fasta <vcf> [<region>]
vk phylo tree (nj|upgma) [--plot] <vcf> [<region>]
The phylo command can be used to generate dendrograms, tree files, or a fasta file of variants concatenated together (equivelent to a multiple sequence alignment) from a VCF. Tree files are generated in Newick format) with MUSCLE using UPGMA or neighbor-joining. VCF-kit can use the output tree file to generate a plot of the tree/phylogeny.
phylo can read a VCF directly or from stdin by using -.
Generate fasta-alignment from variant calls
The phylo fasta command generates a fasta file by concatenating all single-nucleotide variants from a VCF for each sample. The first allele of each genotype is used (for example, for diploid organisms with an A/T genotype, A would always be used). Heterozygous calls should be avoided when using the phylo command. Missing values are replaced with a N. The fasta sequence is constructed in memory - so it can be somewhat resource intensive for larger files.
vk phylo fasta <vcf>
Output:
>QG536 <-- Sample 1
AGGGATCCTNGGG...
>GXW1 <-- Sample 2
AGAGATCCCTGGG...
>DL200 <-- Sample 3
AGAGANCCCTGGN...
Generate fasta-alignment from stdin
You may be interested in filtering variants prior to generating a fasta file. The command below reads from stdin.
bcftools filter --set-GTs . --exclude 'FMT/DP < 20' data/test.vcf.gz | vk phylo fasta -
Generating a tree/phylogeny
vk phylo tree can be used to generate a tree/phylogeny from a vcf file. This command uses a fasta file (identical to what is produced using vk phylo fasta), and uses [MUSCLE](https://en.wikipedia.org/wiki/MUSCLE_(alignment_software) to produce a tree file.
Generate a UPGMA tree
An unweighted pair group method with arithmetic-mean (UPGMA) tree can be constructed using the following command. Output is in newick format.
vk phylo tree upgma <vcf>
Operating on regions
The phylo command can be used on specific regions or chromosomes.
Operate on specific chromosome
vk phylo tree upgma <vcf> I
Operate on specific region
vk phylo tree upgma <vcf> I:1-10000
Generate a neighbor-joining tree
An neighbor-joining tree can be constructed using the following command. Output is in newick format.
vk phylo tree nj <vcf>
Generate fasta sequences from variant data. This is useful for generating phylogenetic trees from VCF files.
Output format
Output - Newick format
The phylo tree command sends output to stdout is newick format. Newick format can be used
(((N2:0.0250154,PX179:0.02262):0.00270637,(((((EG4946:0.035835,AB1:0.0349638):0.00435886,GXW1:0.0490124):0.00222221,(((WN2001:0.0850733,CB4856:0.130009))...
Plot a phylogeny using R
The following script can be used to plot your phylogeny using R. You will need to install tidyverse, ape, ggmap, and phyloseq to use it. You can install them using :
install.packages("tidyverse")
source('http://bioconductor.org/biocLite.R')
biocLite(c('ape','phyloseq','ggmap'), suppressUpdates=TRUE)
library(tidyverse)
library(ape)
library(ggmap)
library(phyloseq)

tree <- ape::read.tree(paste0("treefile.newick"))

# Optionally set an outgroup.
# tree <- root(tree,outgroup = "outgroup", resolve.root = T)

treeSegs <- phyloseq::tree_layout(
                                phyloseq::phy_tree(tree),
                                ladderize = T
                                )

treeSegs$edgeDT <- treeSegs$edgeDT  %>%
                   dplyr::mutate(edge.length =
                                    ifelse(edge.length < 0, 0, edge.length)
                                 , xright = xleft + edge.length
                                 )
edgeMap = aes(x = xleft, xend = xright, y = y, yend = y)
vertMap = aes(x = x, xend = x, y = vmin, yend = vmax)
labelMap <- aes(x = xright+0.0001, y = y, label = OTU)

ggplot(data = treeSegs$edgeDT) + geom_segment(edgeMap) +
  geom_segment(vertMap, data = treeSegs$vertDT) +
  geom_text(labelMap, data = dplyr::filter(treeSegs$edgeDT, !is.na(OTU)), na.rm = TRUE, hjust = -0.05) +
  ggmap::theme_nothing() +
  scale_x_continuous(limits = c(
    min(treeSegs$edgeDT$xleft)-0.15,
    max(treeSegs$edgeDT$xright)+0.15
  ),
  expand = c(0,0))
The above script will output something that looks like this:
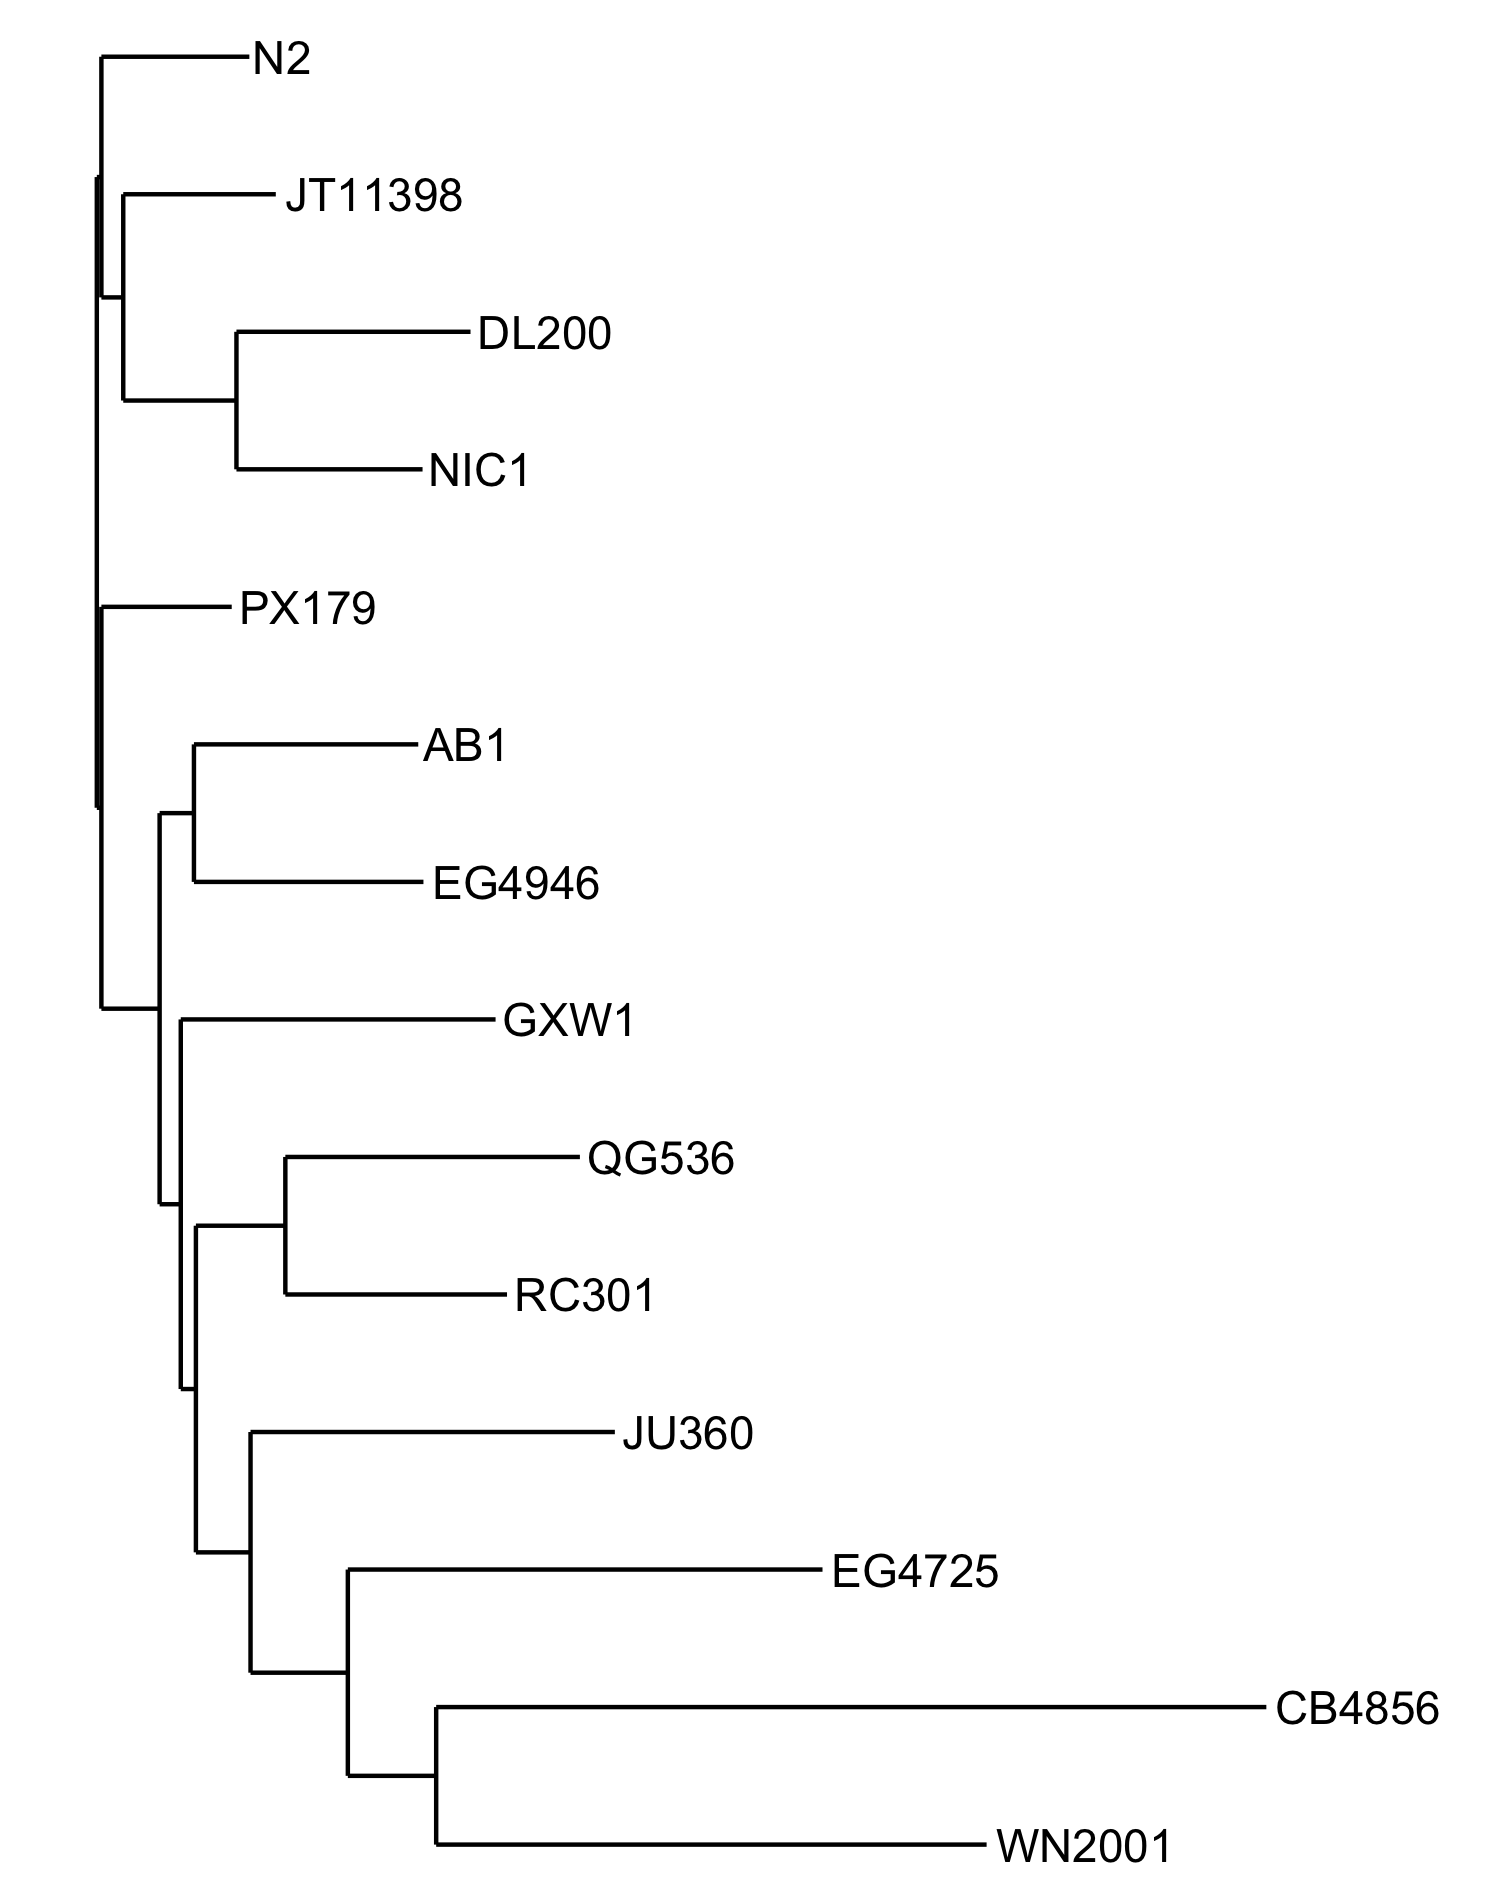
Plot a phylogeny in your web browser
phylo tree can be used to generate a plot of a phylogeny in your web browser by adding the --plot flag.
vk phylo tree nj --plot <vcf>
